1. Introduction
Rural development remains central to inclusive development because people’s spatial location with respect to residence strongly influences their access to markets, education, healthcare, infrastructure, information and decent work.
| [3] | Andrea, C., Anjali, A., David, L. B., Luc, C., & David, K. E. (2022). Economic and social development along the urban–rural continuum: New opportunities to inform policy. World Development, 157, 105941.
https://doi.org/10.1016/j.worlddev.2022.105941 |
[3]
. Socio-economic deprivation is therefore broader than low income. It describes overlapping disadvantages that constrain the ability of households to attain socially acceptable living conditions and to participate effectively in economic and community life. These disadvantages may be expressed through unemployment or insecure work, inadequate housing, overcrowding, poor water and sanitation, unreliable electricity, poor transport system, low educational attainment, limited access to healthcare and social exclusion. The multidimensional characteristics of socio-economic deprivation is particularly important for rural planning because one deficit often intensifies another: poor roads increase transport costs and reduce access to schools, clinics and markets; poor electricity constrains enterprise and learning; low incomes reduce the capacity to improve housing; and inadequate services can accelerate rural–urban migration, thereby deepening socio-economic deprivation. Over 75% of rural women in Nigeria are multidimensionally poor, with living standards are the largest area of deprivation and key deficits in security, employment, and healthcare
| [12] | Oyebamiji, O. A. (2023). Multidimensional poverty in South-West Nigeria: Empirical insights from a household survey in Osun State. Poverty & Public Policy, 15(2), 227–250.
https://doi.org/10.1002/pop4.365 |
[12]
. Similarly, Health, living standards, and education are the largest contributors to rural multidimensional poverty, and that off-farm income significantly reduces deprivation.
Moreso, it was identified that income below minimum wage, education, and rural/female-headed households are strong predictors of multidimensional poverty, while access to electricity reduces poverty.
The situation of Rivers State with respect to rural development is paradoxical. It is a major oil-producing state with significant industrial and commercial activity, yet many rural and riverine communities still have limited access to potable water, reliable electricity, quality schools, functional health care, roads, employment and other basic services. The Niger Delta's ecological context – creeks, wetlands, riverine settlements and difficult terrain – contributes to the cost of providing infrastructure. But physical geography alone cannot explain persistent deprivation. The impact of resource wealth on household welfare depends on the quality of governance, project selection, maintenance, institutional coordination, community participation and the spatial distribution of investment.
| [6] | Mberu, B. U., & Pongou, R. (2022). Oil-rich but poor: The Paradox of Resource Wealth and Rural Poverty in Nigeria’s Niger Delta. African Development Review, 34(1), 23–38.
https://doi.org/10.1111/1467-8268.12551 |
| [9] | Niger Delta Budget Monitoring Group. (2021). Annual Report on Budget and Resource Allocation in the Niger Delta. Niger Delta Budget Monitoring Group.
https://www.ndbmg.org/reports/2021 |
[6, 9]
.
Successive governments have tried to tackle rural and Niger Delta development through programs and agencies such as agricultural development programs, rural infrastructure initiatives by the Oil Minerals Producing Areas Development Commission and, since 2000, the Niger Delta Development Commission (NDDC). Recent literature poses the question of whether the scale of intervention has been matched by durable outcomes. However, researches carried out showed that there are meaningful impacts, though with persistent issues in governance, implementation and sustainability
| [3] | Andrea, C., Anjali, A., David, L. B., Luc, C., & David, K. E. (2022). Economic and social development along the urban–rural continuum: New opportunities to inform policy. World Development, 157, 105941.
https://doi.org/10.1016/j.worlddev.2022.105941 |
| [5] | Etuk, U. D. (2024). Intervention agencies and rural electrification in Akwa Ibom State: A case of the Niger Delta Development Commission (NDDC). AKSU Journal of Administration and Corporate Governance. |
| [7] | Monday, T. U. (2023). State capture and corruption in government agencies in Nigeria: A study of Niger Delta Development Commission in Bayelsa State. Nnamdi Azikiwe Journal of Political Science. |
| [11] | Okpachu, A. S., & Arene, C. J. (2024). Multidimensional poverty among rural women in Nigeria: Evidence from the 2018/19 national survey. Heliyon, 10(5), e25486.
https://www.sciencedirect.com/science/article/pii/S2405844024011782 |
[3, 5, 7, 11]
. This mixed evidence means that program presence cannot be assumed as being equivalent to program effectiveness. Effectiveness should be considered in terms of changes in real living conditions of the intended beneficiaries,
The main focus of this research is to measure socio-economic deprivation as a multidimensional condition differentiated spatially rather than a single poverty statistic and investigation of whether government intervention programs have made a meaningful difference in the household living conditions. A major planning gap identified was the lack of a comprehensive deprivation index developed from the local context. This study examines the effectiveness of government intervention programs in reducing multidimensional socio-economic deprivation and promoting rural development. The Alkire – Foster tradition, national multidimensional poverty indices and place-based deprivation indices acknowledged that households can be deprived simultaneously in education, health, living standards and access to services even where income alone does not classify them as poor.
| [2] | Alkire, S., & Foster, J. (2011). Counting and multidimensional poverty measurement. Journal of Public Economics, 95(7-8), 476–487. https://doi.org/10.1016/j.jpubeco.2010.11.006 |
| [15] | World Bank. (2024, December 13). Nigeria to Enhance Road Infrastructure to Benefit Four Million in Rural Communities. World Bank. |
[2, 15]
. It was revealed that in Nigeria, multidimensional poverty in Osun State rural households was still high, and that living standards, internet access and education were important contributors.
| [13] | Stouffer, S. A., Suchman, E. A., DeVinney, L. C., Star, S. A., & Williams, R. M., Jr. (1949). The American soldier: Adjustment during army life (Vol. 1). Princeton University Press. |
[13]
This backs the current study in the decision to study housing quality, infrastructure, education, employment and accessibility in a collective manner rather than using income as the sole indicator.
The national MPI evidence is relevant for Rivers State as it confirms a significant rural disadvantage. NBS found rural multidimensional poverty to be substantially higher than urban poverty and documented overlapping deficits in housing, sanitation, healthcare and energy
| [8] | National Bureau of Statistics. (2022). Nigeria multidimensional poverty index 2022. Federal Government of Nigeria. |
[8]
. The research extends this national picture by measuring deprivation at the household and LGA levels in Rivers State and by integrating both objective indicators and subjective perceptions. This combination is important as objective service deficits can be perceived differently by households, depending on their expectations, comparison groups and local norms. Household conditions such as income, education, employment, electricity, housing quality provide useful lens through which socio-economic deprivation is x-rayed. Housing quality is a measure of the household’s accumulated resources, access to infrastructure, investment in the neighbourhood and the effectiveness of public planning. Overcrowding may be a sign of income constraints and housing shortage. However, unsafe or deteriorating roofs, floors and windows are a sign of physical deprivation. Shared facilities and inadequate water or electricity are a sign of service deficits. Poor road accessibility limits the functional value of otherwise adequate housing. Deprivation indices are therefore useful not only as descriptive measures but as tools for spatial planning that can identify clusters of need and help prioritise investment.
Accessibility is another key link between deprivation and rural development. Rural roads link households to agricultural markets, schools, health facilities and employment centers. The World Bank approved the Rural Access and Agricultural Marketing Project Scale-Up to rehabilitate and maintain rural roads, noting explicitly the connection between connectivity and access to markets, jobs, social services and inclusion, highlighting that a significant portion of Nigeria’s road network is in poor condition.
| [15] | World Bank. (2024, December 13). Nigeria to Enhance Road Infrastructure to Benefit Four Million in Rural Communities. World Bank. |
[15]
This national policy direction is consistent with the research findings that more than half of sampled buildings were not accessible by car and respondents are concerned about road conditions and transportation costs.
Empirical evaluations of Niger Delta interventions show a mixed pattern. Akinyoade highlighted the interaction between project design and community context in determining the outcomes of interventions in her study of NDDC social services in Odi, Bayelsa State
| [1] | Akinyoade, D. V. (2022). Theorizing the negative impacts of the Niger Delta Development Commission’s social services in Odi Community, Bayelsa State, Nigeria. Nigerian Journal of Peace, Development & Humanitarian Affairs.
https://doi.org/10.53982/njpdha.2022.0105-n |
[1]
Monday faulted governance and corruption matters for poor NDDC performance in Bayelsa State.
| [7] | Monday, T. U. (2023). State capture and corruption in government agencies in Nigeria: A study of Niger Delta Development Commission in Bayelsa State. Nnamdi Azikiwe Journal of Political Science. |
[7]
Etuk) in his study on rural electrification in Akwa Ibom State concluded that NDDC interventions had not brought desired impact in rural socio-economic conditions.
| [5] | Etuk, U. D. (2024). Intervention agencies and rural electrification in Akwa Ibom State: A case of the Niger Delta Development Commission (NDDC). AKSU Journal of Administration and Corporate Governance. |
[5]
By contrast, more recent work on road construction in Cross River and Akwa Ibom states reported significant positive effects on economic activities and livelihoods, while identifying infrastructure gaps that required further attention. Together, these studies suggest that intervention effects are sector-, location-, project quality- and institutional environment-dependent.
This means that an evaluation should differentiate between, coverage, satisfaction and measurable association with living conditions. A program can reach a lot of households without addressing their worst deprivation. Similarly, a statistically significant association may have a small effect size and thus be of limited practical importance. In this regard, this study is valuable because it reports both the proportion of households reached by programs and the strength of the relationship between program exposure and infrastructure conditions. This allows a more complex interpretation than a simple statement that interventions either “work” or “do not work.”
The study also provides theoretical support for relative deprivation and social exclusion perspectives. Relative deprivation theory emphasises the subjective element of deprivation derived from a comparison between actual and expected situations, whereas social exclusion relates to diminished involvement in economic, social and political life.
| [14] | Yamane, T. (1973). Statistics: An Introductory Analysis. 3rd Edition, Harper and Row, New York. |
[14]
Models of spatial development such as growth-pole, core-periphery and accessibility help to explain why economic concentration in urban centers does not necessarily lead to adequate spread effects in peripheral communities. For the rural Rivers State, these perspectives suggest that development cannot be based on passive trickles down from Port Harcourt or the growth of the oil sector. Instead, there is a need for deliberate spatial redistribution of infrastructure and opportunities.
There is therefore a clear research gap in the literature. While national and regional studies point to extensive multidimensional poverty and continued concerns over Niger Delta interventions, they fail to provide a sufficient context-specific measure of socio-economic deprivation across rural LGAs in Rivers State, while simultaneously testing the effectiveness of recent intervention exposure. The research fills this void with a locally developed socio-economic deprivation index and study-area socio-economic deprivation profile ranking of specific housing deficits; household-level programmed-benefit data; and inferential tests of the relationship between deprivation, housing and intervention outcomes.
Objectives, Research Questions and Hypotheses
This research aims at evaluating the effectiveness of government intervention programs in reducing socio-economic deprivation and promoting rural development in Rivers State, Nigeria Specifically, the study intends to:
1) Describe household socio-economic conditions;
2) Assess objective and subjective socio-economic deprivation;
3) Derive socio-economic deprivation index (SEDI);
4) Identify the impacts of socio-economic deprivation;
5) Identify rural development programmes available to improve household conditions; and
6) Determine planning approaches for reducing socio-economic deprivation.
Two null hypotheses were tested at the 0.05 significance level:
H01: There is no significant relationship between socio-economic deprivation and household housing conditions in the study area.
H02: There is no significant difference in living conditions between households that have benefited from rural development programmes and those that have not.
2. Materials and Methods
2.1. Description of the Study Area
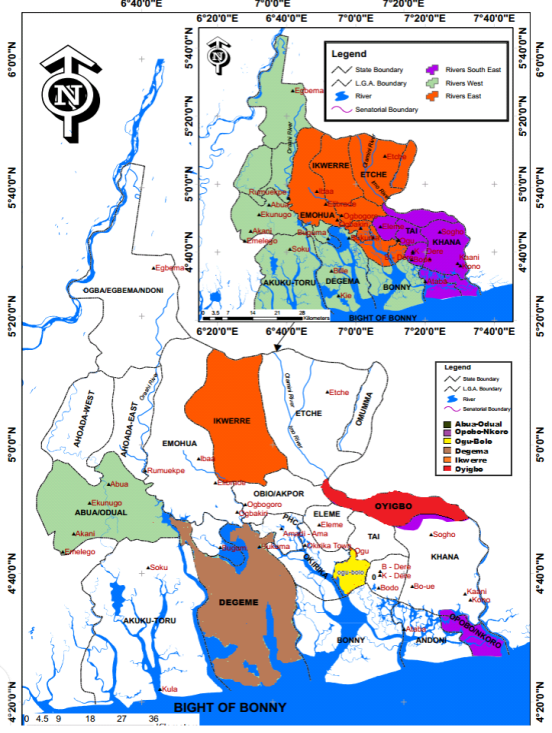
Rivers State is a coastal state located in the Niger Delta region of Nigeria. The State is made up of twenty-three (23) Local Government Areas (LGAs) with Port Harcourt city as the Headquarters. The City is bounded by Bayelsa and Delta state in the west, Imo State in the north, Uyo and Abia States in the east as well as the Atlantic Ocean in the southern segment. The study area is located within latitudes 4
o20’0”N and 5
o40’0”N and longitudes between 6
o40’0”E and 7
o20’0”E (
Figure 1). The state has three Senatorial Distracts of Rivers West, Rivers East and Rivers South respectively. Additionally, among the six states (Rivers, Akwa Ibom, Cross Rivers, Bayelsa, Delta and Edo) in the South-South Geopolitical Zone of Nigeria, Rivers State is the most populated state endowed with its natural resources in the various communities.
| [9] | Niger Delta Budget Monitoring Group. (2021). Annual Report on Budget and Resource Allocation in the Niger Delta. Niger Delta Budget Monitoring Group.
https://www.ndbmg.org/reports/2021 |
[9]
. There are two major seasons that distinguish the climate of Rivers State: the wet and the dry seasons. The wet season is characterized by high rainfall from April to October whereas the dry season experience high temperatures from November to March. The region also experiences high humidity throughout the year.
Figure 1. Map of Rivers State showing the Study Areas.
2.2. Research Philosophy and Approach
The study adopted a transformative research philosophy and a mixed-methods approach. A concurrent triangulation design was used so that quantitative household data and qualitative evidence from key informants were collected and interpreted as complementary sources. The quantitative component measured household socio-economic conditions, deprivation, housing and programme exposure, while the qualitative component obtained expert and community perspectives from Ministries, Departments and Agencies (MDAs), built-environment professionals and community leaders. Integration of both strands was intended to improve interpretation and validation of the findings.
The geographical scope comprised 21 rural communities in six LGAs across Rivers State. The selected LGAs were Ikwerre and Ogu/Bolo, Opobo/Nkoro, Oyigbo, Abua/Odual and Degema. The research projected the population of the six selected LGAs from the 1991 census base using a 3.2% annual growth rate, producing an estimated study population of approximately 1,505,286 persons. Communities were selected from the census-listed settlements using a rural population threshold and multistage procedures. The 1991 census data was used for the projection since the Nigeria 2006 population was not disaggregated.
Sampling proceeded in stages. The 23 LGAs were first organized by senatorial district; two LGAs were selected from each district. From 207 communities listed in the study area, 21 communities—approximately 10% coverage—were selected. The household sample size of 399 was determined using the Taro Yamane formula at a 5% precision level.
| [14] | Yamane, T. (1973). Statistics: An Introductory Analysis. 3rd Edition, Harper and Row, New York. |
[14]
The simple random sampling method was used to select households, while 73 key informants with relevant institutional, professional or community knowledge were selected using the judgmental sampling. The intervention tables in the research report 372 valid household observations, indicating that the effective response base for those analyses was lower than the originally determined sample.
Primary data were collected through face-to-face questionnaires administered to household respondents and interviews with key informants. Secondary sources included maps, government records and published materials. The instrument covered education, employment, income, household size, housing materials and condition, overcrowding, water, electricity, cooking energy, road access, transportation, healthcare, educational facilities, distance to services, perceived deprivation, government intervention exposure, programme satisfaction and perceived impacts.
Data were processed with SPSS. Descriptive statistics included frequencies, percentages and inferential measures. A socio-economic deprivation index was developed from 7 indicators (education, unemployment, income, water, electricity, overcrowding and cooking energy) enabling comparison across LGAs.. Chi-square tests assessed the relationship between socio-economic deprivation and housing condition and between development-programme exposure and infrastructure access. Phi, Cramer’s V and contingency coefficients were reported to indicate effect strength. Qualitative responses were used to contextualize and triangulate quantitative patterns.
The analytical interpretation emphasizes both statistical significance and substantive effect. This is important for programme evaluation: rejecting a null hypothesis does not by itself demonstrate that an intervention is sufficiently strong to transform living conditions. The size of the association, beneficiary satisfaction and persistence of deprivation must be considered together. Because the design is cross-sectional and observational, the results should be interpreted as evidence of association rather than definitive causal attribution.
3. Results and Discussion
3.1. Household Socio-economic and Infrastructure Conditions
The household profile showed substantial social and economic disadvantage. The findings reports that 25.8% of the population had no formal education and that 21.5% of children aged 15 were not attending school. Employment was also limited: only 30.9% were reported as employed. Income deprivation was evident, indicating 25.9% earning less than the national minimum wage and 53.9% however, placing them within the low-income group. These indicators reveal that deprivation extends from human-capital formation into labour-market participation and household purchasing power. Infrastructure deficits were equally pronounced. About 67.3% of households lacked water supply, 58.9% lacked electricity and 86.8% lacked telephone access. In addition, 58.1% of buildings were inaccessible by car. These conditions have cumulative implications. Lack of reliable water increases household time and health burdens; electricity deficits limit productive activity and learning; weak communications constrain information access; and poor road accessibility increases the effective distance to markets, schools, clinics and employment opportunities.
3.2. Socio-economic Deprivation and Spatial Variation
Table 1. Household Socio-economic and Infrastructure Conditions.
Indicator | Percentage (%) |
No formal education | 25.8 |
Children aged 15 not attending school | 21.5 |
Employed population | 30.9 |
Earning less than minimum wage | 25.9 |
Low-income group (total) | 53.9 |
Households without water supply | 67.3 |
Households without electricity | 58.9 |
Households without telephone access | 86.8 |
Buildings inaccessible by car | 58.1 |
Source: Researcher’s Field Data, 2025
The household profile shows substantial social and economic disadvantage. The findings reports that 25.8% of the population had no formal education and that 21.5% of children aged 15 were not attending school. Employment was also limited: only 30.9% were reported as employed. Income deprivation was evident, indicating 25.9% earning less than the national minimum wage and 53.9% however, placing them within the low-income group. These indicators revealed that deprivation extends from human-capital formation into labour-market participation and household purchasing power. Infrastructure deficits were equally pronounced. About 67.3% of households lacked water supply, 58.9% lacked electricity and 86.8% lacked telephone access. In addition, 58.1% of buildings were inaccessible by car. These conditions have cumulative implications. Lack of reliable water increases household time and health burdens; electricity deficits limit productive activity and learning; weak communications constrain information access; and poor road accessibility increases the effective distance to markets, schools, clinics and employment opportunities.
3.3. Socio-Economic Deprivation and Spatial Variation
Table 2. Socio-Economic Deprivation Index by LGA.
LGA | Education Deprivation (%) | Unemployment (%) | Income Inadequacy (%) | No Water (%) | No Electricity (%) | Overcrowding (%) | Cooking-Energy Deprivation (%) | SEDI | Rank |
Abua-Odual | 16.4 | 44.8 | 69.0 | 82.8 | 31.0 | 91.4 | 91.4 | 61.0 | 1 |
Opobo-Nkoro | 25.3 | 31.5 | 73.0 | 58.4 | 30.3 | 100.0 | 100.0 | 59.8 | 2 |
Degema | 10.9 | 21.7 | 87.0 | 56.5 | 21.7 | 100.0 | 100.0 | 56.8 | 3 |
Ikwerre | 67.6 | 35.3 | 76.5 | 17.6 | 0.0 | 100.0 | 100.0 | 56.7 | 4 |
Oyigbo | 36.0 | 48.0 | 76.0 | 18.0 | 0.0 | 62.0 | 60.0 | 42.9 | 5 |
Ogu-Bolo | 10.7 | 23.0 | 63.0 | 24.4 | 3.7 | 88.1 | 80.7 | 42.0 | 6 |
Study Area | 21.1 | 32.3 | 70.2 | 42.5 | 14.8 | 89.2 | 86.3 | 50.9 | — |
Source: Researcher’s Compilation, 2025
Abua-Odual has the highest deprivation (SEDI 61.0), mainly due to poor water supply, overcrowding, low income, and high unemployment. Opobo-Nkoro (SEDI 59.8) also faces severe overcrowding, cooking-energy deprivation, and widespread income inadequacy. Degema (SEDI 56.8) is marked by strong economic hardship and housing pressure, with all households experiencing overcrowding. Ikwerre (SEDI 56.7) benefits from better electricity and water access but is set back by educational deprivation and income issues. Oyigbo (SEDI 42.9) has good infrastructure access but records the highest unemployment among the LGAs. Ogu-Bolo (SEDI 42.0) is the least deprived, with relatively better water and electricity supply but still notable overcrowding and reliance on traditional energy. On the overall, all LGAs experience moderate to high socio-economic deprivation, with the most acute challenges found in Abua-Odual and Opobo-Nkoro.
Table 3. Study-Area Socio-economic Deprivation Profile.
Deprivation Dimension | Study-Area Rate (%) | Interpretation |
Overcrowding | 89.2 | Very high deprivation |
Cooking-energy deprivation | 86.3 | Very high deprivation |
Income inadequacy | 70.2 | High deprivation |
Water deprivation | 42.5 | Moderate deprivation |
Unemployment | 32.3 | Moderate deprivation |
Educational deprivation | 21.1 | Low-moderate deprivation |
Electricity deprivation | 14.8 | Relatively low deprivation |
Source: Researcher’s Compilation, 2025
From the study area socio-economic deprivation profile in
Table 3, overcrowding emerged as the most severe dimension, affecting approximately 89.2% of the sampled households under the criterion of four or more persons sleeping in a room. The survey records 290 households with four to six persons sleeping in a room and another 42 with seven to nine persons, compared with only 40 households reporting one to three persons per room.
Cooking-energy deprivation follows closely at 86.3%. Across the study area, only 51 households reported gas as their principal cooking-energy source, compared with 63 using kerosene, 227 charcoal and 31 firewood. This demonstrates a substantial dependence on traditional or less-clean household energy sources.
Income inadequacy, at 70.2%, constitutes the third major component of deprivation. This is particularly important because inadequate income can reinforce other forms of deprivation by reducing the capacity of households to improve housing, obtain reliable water, use cleaner energy, pay for health care and meet transport and education costs.
Water deprivation remains substantial at 42.5%, whereas electricity deprivation is much lower at 14.8%. The contrast indicates that electricity coverage is relatively stronger than household water infrastructure in the study area. Water sources are also fragmented: only 40 respondents depended on public mains, while 147 used private boreholes, 80 water vendors, 22 tanker vehicles and 83 wells/rainfall.
3.4. Reach and Perceived Effectiveness of Government Intervention
Only 44.9% of respondents reported benefiting from at least one government intervention during the preceding five years, while 55.1% reported no benefit. The programmes identified included road construction or rehabilitation, rehabilitation of government schools and health centres, youth empowerment, housing schemes, loan incentives, agricultural incentives and street lighting. Street-light interventions and road works were the most frequently reported among the listed activities. This pattern indicates a strong infrastructure orientation, but a much smaller presence of livelihood, housing, health and agricultural support.
Table 3. Government Intervention Coverage and Satisfaction (valid n=372).
Measure | Yes | No |
Benefited from a government Intervention in preceding five years | 44.9% (167) | 55.1% (205) |
Satisfied with government intervention programmes | 34.1% (127) | 65.9% (245) |
Source: Author’s Field Data, 2025
Satisfaction was considerably lower than would be expected from a transformative rural-development programme: only 34.1% of respondents expressed satisfaction, whereas 65.9% were dissatisfied. Satisfaction is not a causal measure of effectiveness, but it is an important indicator of perceived relevance, quality, coverage and sustainability. When combined with the continuing infrastructure and housing deficits, the low satisfaction rate suggests a mismatch between programme outputs and the multidimensional needs of households.
3.5. Social and Psychological Impacts of Deprivation
The most frequently reported impact was reduced quality of life (34.4%), followed by inability to fulfil personal aspirations (13.4%) and low self-esteem (10.8%). depression and higher risk of underdevelopment were also identified, while qualitative evidence pointed to illiteracy, stress, hunger and social exclusion. These results reinforces the conceptual argument that deprivation is not merely material. Persistent inability to access socially expected services and opportunities can affect dignity, social participation, psychological wellbeing and confidence in institutions.
3.6. Hypothesis Tests
Table 4. Summary of Inferential Results.
Test | χ² | Df | P | Cramer’s V | Strength | Decision |
Deprivation × housing condition | 48.672 | 4 | <.001 | .256 | Moderate | Reject H01 |
Programme × infrastructure access | 8.921 | 2 | .012 | .155 | Weak | Reject H02 |
Programme × water supply | 10.21 | 2 | .006 | .166 | Weak | Significant |
Programme × roof condition | 4.33 | 3 | .228 | .076 | Negligible | Not significant |
Programme × neighbourhood condition | 13.17 | 4 | .011 | .133 | Weak | Significant |
Source: Authors’ Field Data, 2025
The first null hypothesis was rejected. Socio-economic deprivation was significantly associated with housing condition, χ²(4)=48.672, p<.001, with Cramer’s V=.256 indicating a moderate relationship. The result confirms that poorer socio-economic circumstances are reflected in housing outcomes and supports the use of housing as an observable component of multidimensional deprivation.
The second null hypothesis was also rejected, χ²(2)=8.921, p=.012. However, Cramer’s V=.155 indicates only a weak relationship between development-programme exposure and infrastructure access. Supporting tests show weak but significant relationships for water supply and neighbourhood condition, while roof condition was not significantly associated with programme exposure. Thus, government programmes appear to have produced some benefits, but the magnitude is insufficient to conclude that they have substantially altered the structural conditions underlying rural deprivation.
3.7. Discussion
The results demonstrated a multidimensional rural-development deficit in Rivers State. Educational exclusion, low employment, low income, inadequate water and electricity, poor communications and road inaccessibility occur together rather than independently. This is consistent with the NBS (2022) national MPI, which shows that rural poverty in Nigeria is both widespread and multidimensional. The present evidence adds an important subnational dimension by showing that deprivation also varies sharply within one resource-rich state.
The spatial SEDI pattern is particularly important for urban and regional planning. Abua-Odual recorded the highest SEDI at 61.0, placing it in the high-deprivation category, driven by inadequate water supply, overcrowding, cooking-energy deprivation, income inadequacy and relatively high unemployment. Only 10 of the 58 sampled households reported water supply in their buildings, while 48 reported no water supply. Opobo-Nkoro ranks second with a SEDI of 59.8, with severe deprivation in several dimensions. All sampled households fall within the overcrowding criterion, cooking-energy deprivation reaches 100%, water deprivation is substantial and income inadequacy is widespread. All 89 sampled households reported four to six persons sleeping in a room. Degema records a SEDI of 56.8, making it the third-most deprived LGA. Its most important problems are income inadequacy, overcrowding and cooking-energy deprivation, with all 23 surveyed households in the four-to-six persons-per-room category. 20 of the 23 respondents indicated household income was inadequate. Ikwerre follows with a SEDI of 56.7. It performs comparatively well in electricity and water access, but the index is raised by educational deprivation, overcrowding, inadequate income and dependence on less-desirable cooking fuels. All 17 sampled households reported electricity access. Oyigbo records a lower SEDI of 42.9. It performs well in electricity access, with all 50 sampled households reporting access, and 41 of the 50 reporting water supply. Unemployment and income inadequacy remain concerns, with 24 of 50 households classified as unemployed, the highest unemployment proportion among the six LGAs. Ogu-Bolo records the lowest SEDI at 42.0, representing moderate deprivation. Its favourable position results from relatively high electricity and water access and lower unemployment. Overcrowding and cooking-energy deprivation remain substantial, indicating a lower relative intensity of deprivation rather than an absence of deprivation.
These differences indicate that equal allocation across LGAs may reproduce inequality because areas with greater accumulated deficits require proportionately greater investment. A deprivation-weighted allocation formula would therefore be more defensible than politically uniform distribution. The SEDI can serve as a screening tool for identifying priority communities, while project-level needs assessments can determine the appropriate mix of water, electricity, housing, roads, schools and health facilities.
The intervention results require careful interpretation. Nearly half of respondents had received some programme benefit, indicating that government activity is visible. Yet most respondents had not benefited, and nearly two-thirds were dissatisfied. More importantly, the inferential test found only a weak relationship between programme exposure and infrastructure access. Statistical significance here should not be mistaken for strong developmental effectiveness. The practical conclusion is that interventions have mattered, but not enough. Their reach, scale, targeting, maintenance or alignment with household priorities remains inadequate.
This conclusion validates the findings from studies on Niger Delta; Etuk (2024) concluded that there will limited socio-economic transformation from NDDC rural electrification intervention programmes in Akwa Ibom. Also, Monday (2023) affirmed that institutional and governance limit effectiveness of NDDC projects. Again, Akinyoade (2022) showed that community situation can be shaped through intervention outcomes. Although, there are indications of progressive road-project effects in Cross River and Akwa Ibom which means well-targeted infrastructure can improve economic activity. However, it would be proper to conclude that intervention agencies are inherently not ineffective, but that effectiveness is conditional on project relevance, implementation quality, maintenance, institutional accountability and community participation.
Road accessibility deserves particular emphasis. The research findings that 58.1% of buildings were inaccessible by car reflects more than a transport inconvenience. It can raise food and construction costs, delay emergency healthcare, reduce school attendance, restrict farm-to-market movement and deter private investment. The rural road project by World Bank in 2024 showed that rural roads are mechanism for transporting agricultural products to markets thereby increasing job creation and access to other social services. In Rivers State, policy on road should be able to account for riverine connectivity, such that waterways, jetties, and other multimodal connections can be as vital as regular roads.
In this study, the identified significant relationship between socio-economic deprivation and housing condition corroborates with the study’s theoretical framework. Relative deprivation is visible in subjective dissatisfaction and perceived inadequacy, while social exclusion is reflected in restricted access to education, employment and services. Core–periphery and accessibility perspectives explain why proximity to major urban and industrial centres does not guarantee rural welfare. Resource concentration can coexist with peripheral deprivation when spread effects are weak and when public investment fails to connect rural settlements to opportunity.
The psychological findings broaden the rural-development agenda. Reduced quality of life, low self-esteem, stress and depression show that socio-economic deprivation affects wellbeing beyond consumption and infrastructure. Development programmes should therefore be evaluated not only by kilometres of road, numbers of boreholes or streetlights installed, but also by service functionality, household time savings, livelihood improvement, accessibility, user satisfaction and social wellbeing. This outcome-oriented approach would shift monitoring from project completion to sustained developmental value.
A further implication concerns programme design. The most commonly reported interventions were street lighting and road works, whereas employment, housing, health and agricultural support appeared less prominent. Yet the socio-economic deprivation profile is multidimensional. A road may improve accessibility but cannot by itself resolve overcrowding, unemployment or lack of potable water. Effective rural development therefore requires coordinated packages of intervention across ministries and agencies, with shared geographic targeting and a common monitoring framework.
Finally, the results support institutionalizing socio-economic deprivation measurement. National MPI data are valuable for broad policy, but local planning requires finer spatial resolution. The study’s SEDI provides a replicable starting point for Rivers State. Periodic updating ideally with geocoded household and facility data could show whether socio-economic deprivation is dipping, whether high-deprivation communities are receiving proportionate resources, and whether completed projects are changing outcomes. Such evidence can strengthen budgeting, accountability and the evaluation of NDDC, state and local-government interventions.





 Share This Article
 Twitter
 Linked In
 Facebook

 Copy
 Download